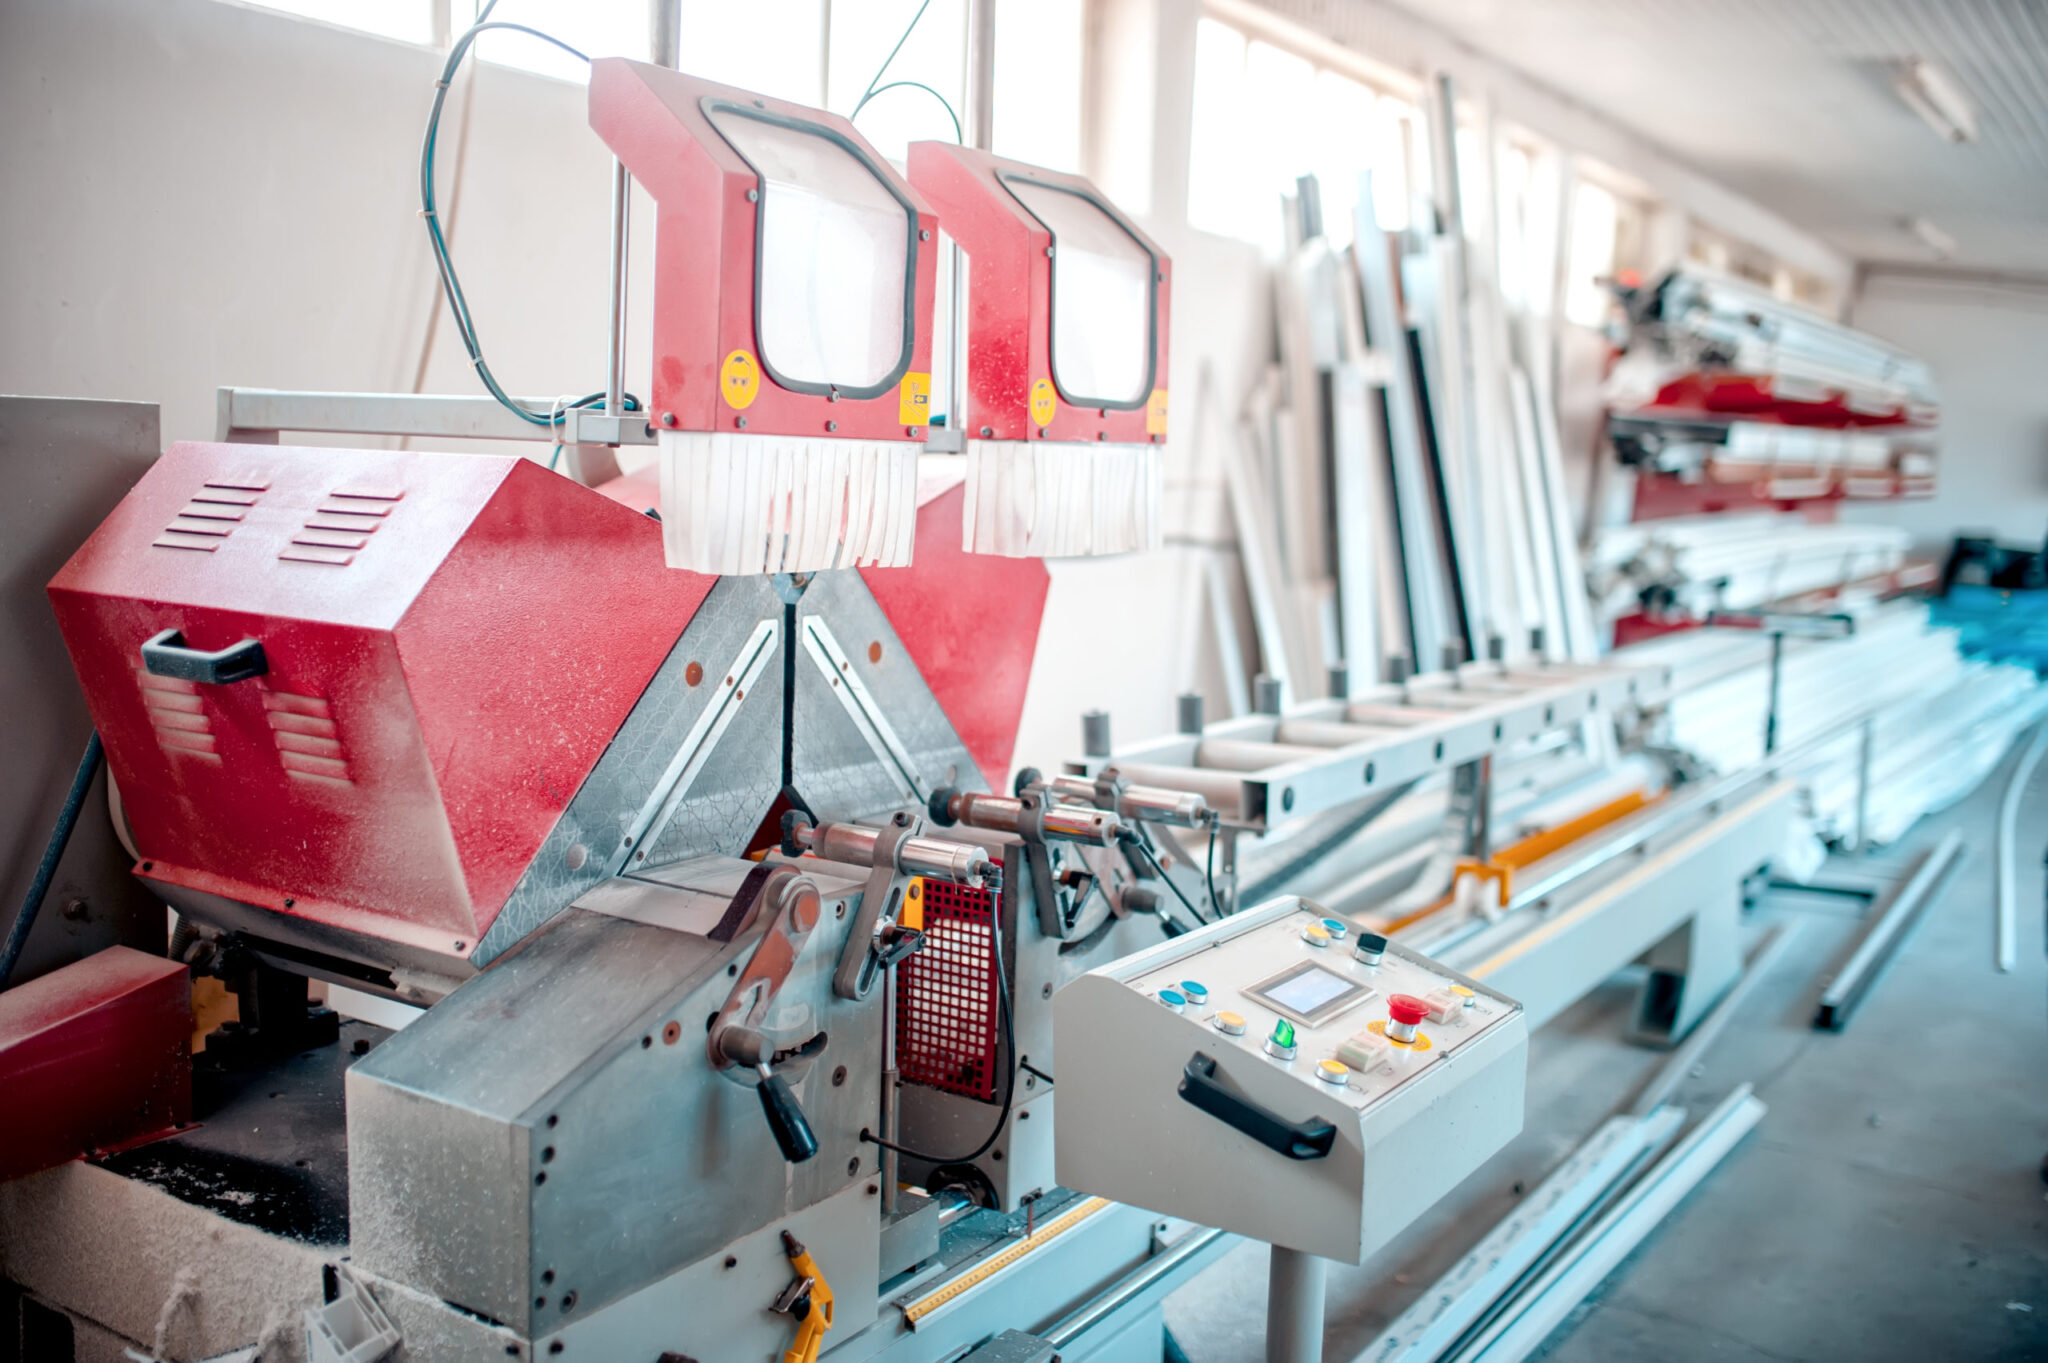
Companies often use “Overall Equipment Effectiveness” (OEE) as a factory metric to measure how effectively a manufacturing process runs. The goal is to establish a baseline score and then update it to track the progress of process improvements over time. Availability, Quality, and Performance measurements are components in calculating an OEE score.
Availability
A determination of the amount of time available versus the plan:
Availability = Planned Production Time – Lost Time / Planned Production Time
Any unplanned downtime negatively impacts the metric. For predictable situations, “Planned Production Time” is quantified by a schedule with any deviation representing lost time. However, there are environments where production stops for unscheduled reasons, and the downtime qualifies as “planned.” When capturing the data, there needs to be a way for someone, typically the operator, to flag them as such.
Performance
Performance is just like it sounds. Is a particular machine running at its optimal capacity or lower? If I know the optimal rate, can I assess the run rate at any given time and make a comparison?
Performance = Actual Rate / Optimal Rate
Quality
Quality represents the number of good products as a proportion of the total production.
Quality = Good Count / Total Count
OEE
The high-level OEE calculation:
OEE = Availability x Performance x Quality
The calculations for components of a production line roll up to a score for the entire line. Multiple line scores combine to represent OEE for a factory. It’s also possible to determine a score for a region or company using the numbers for each factory as input.
Implementation
When reporting OEE in some manufacturing operations, these calculations are a part of the routine but involve a lot of manual collection and input. It makes sense to automate, but often the numbers will get worse. Like any change, it’s important to get employee buy-in. Remember that a lower quality metric, for example, doesn’t mean a less suitable product. Instead, it says we have some potential for improvement.
Opportunities for automation:
- Automated scheduling with a means to identify Unplanned Stops (breakdowns) and Planned Stops (shift changes)
- Wireless (LoRaWAN) or wired (Modbus) connections to gather existing data from machines
- Creating an interface using a protocol like MQTT
- Adding sensors, cameras, etc., to provide new information and automate tasks like quality inspections
Visualization of the current numbers is valuable, and using the standard red, yellow and green colors on a dashboard provides an “at-a-glance” view. In addition, historical data on well-designed charts tracks improvement, highlighting issues with a particular time of day, shift, etc.
Security is a concern with any new technology. For example, connecting machinery to networks can make it vulnerable. Fortunately, there are ways to collect data without introducing risk by choosing the proper hardware, networking, and protocols.
Like other metrics, OEE contributes to understanding how the operation is functioning. With proper implementation, additional monitoring can improve results by identifying opportunities for improvement.

